How To Create A Frequency Analysis Using HAT Screen 10

How To Create A Frequency Analysis Using HAT (Hub Audio Tools)

Checking Audio Shows For Lossy Sources

Possibly the easiest way to create a frequency analysis is using the HAT software. For your convenience I have a download of this tool HERE.

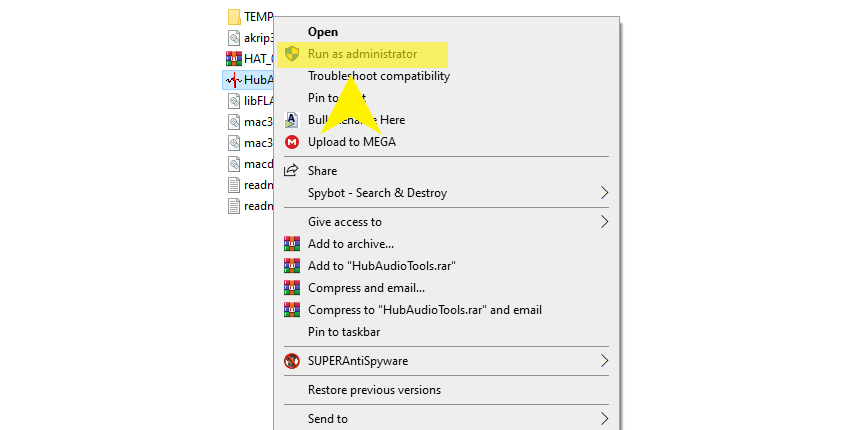
NOTE: The HAT tool will need to be run as an administrator if you are using Windows 7 or above for it to work properly. To run it as an administrator simply right click the “HubAudioTools.exe” file and in the menu choose “Run as administrator“.

How To Create A Frequency Analysis Using HAT Screen 1

What is a frequency analysis?

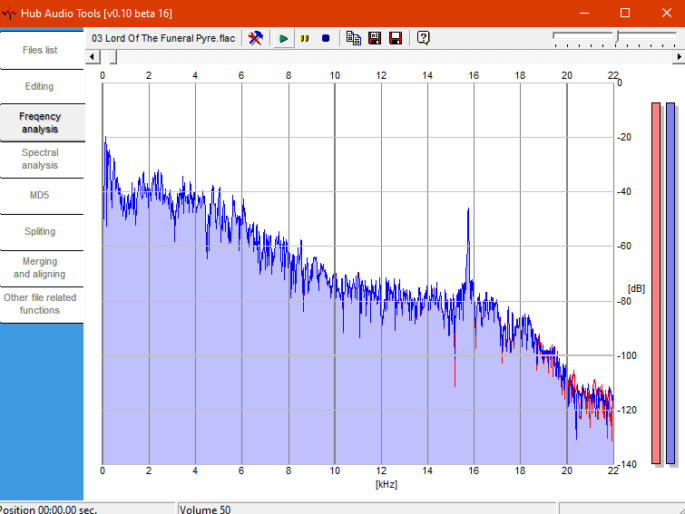
Simply put, its a frequency graph that you can use to find out if a show is mp3 or lossy sourced.

Why do traders use frequency analysis?

Many traders do not wish to “pollute” the trading pool with lossy sourced shows. Traders use the frequency analysis to determine if a show is lossy sourced. This is the quickest & easiest way to find out if your show is true lossless or not.

GETTING STARTED:

The first thing you will need to do is have your HAT ready.

STEP 1:

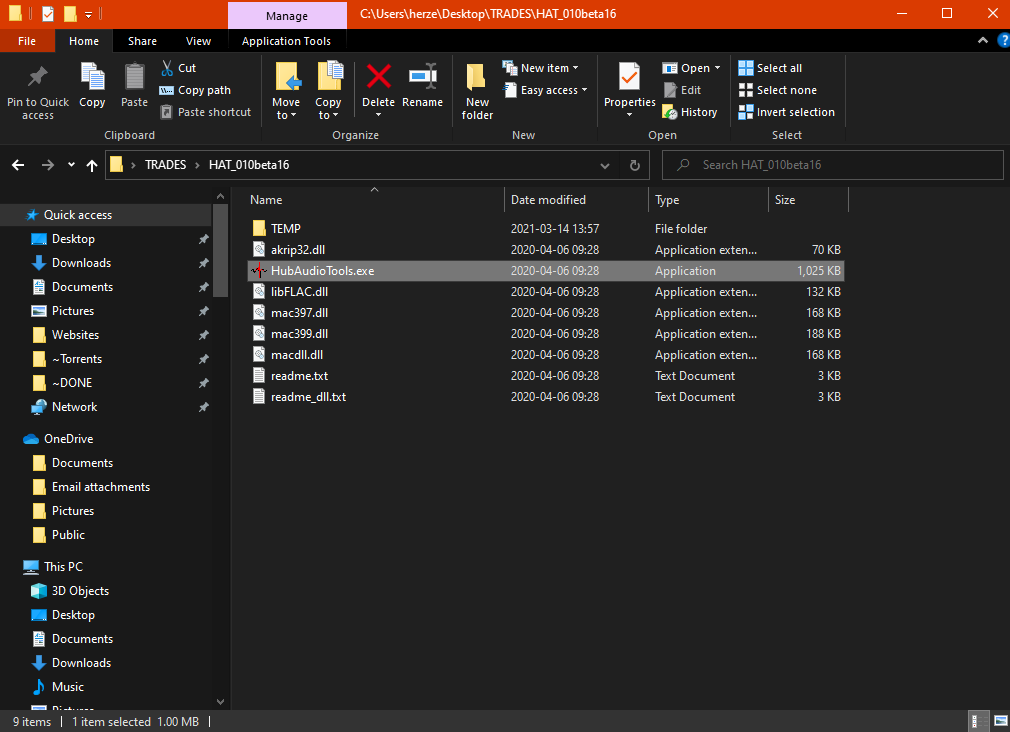
If you have not already download the HAT tool and unzip it to a place on your computer where you can locate it easily. I unzipped mine to a “TRADE” folder that I leave on my desktop.

STEP 2:

Open your HAT tools & prepare to find a file to analyze.

How To Create A Frequency Analysis Using HAT Screen 2

HAT OPENED:

How To Create A Frequency Analysis Using HAT Screen 3

STEP 3:

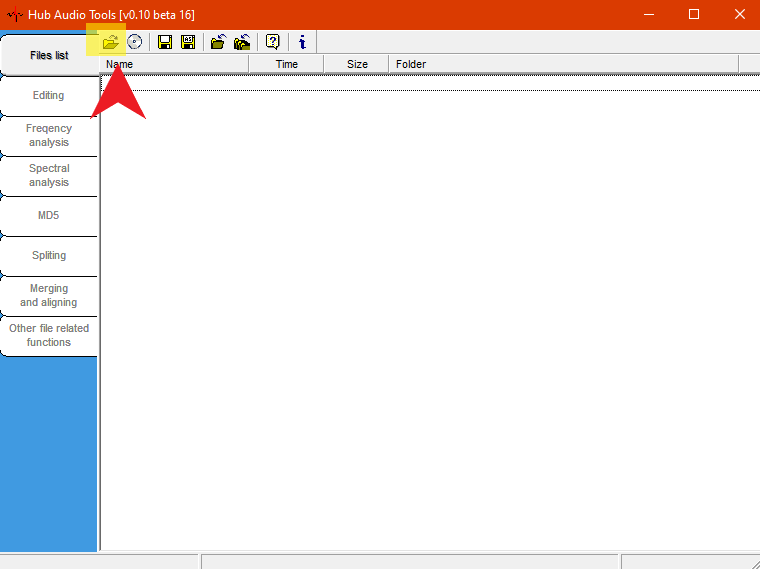
To analyze a file you just need to click the folder at the top left.

How To Create A Frequency Analysis Using HAT Screen 4

STEP 4:

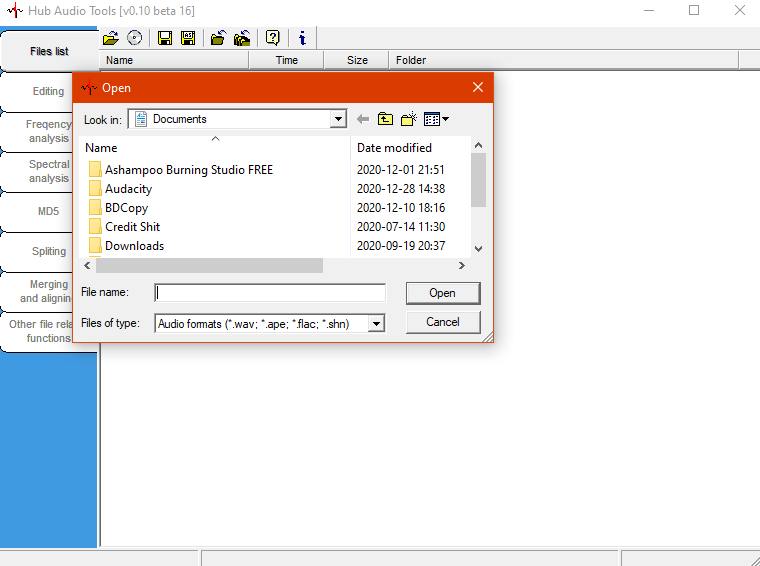
Navigate to the file you want to analyze.

How To Create A Frequency Analysis Using HAT Screen 5

STEP 5:

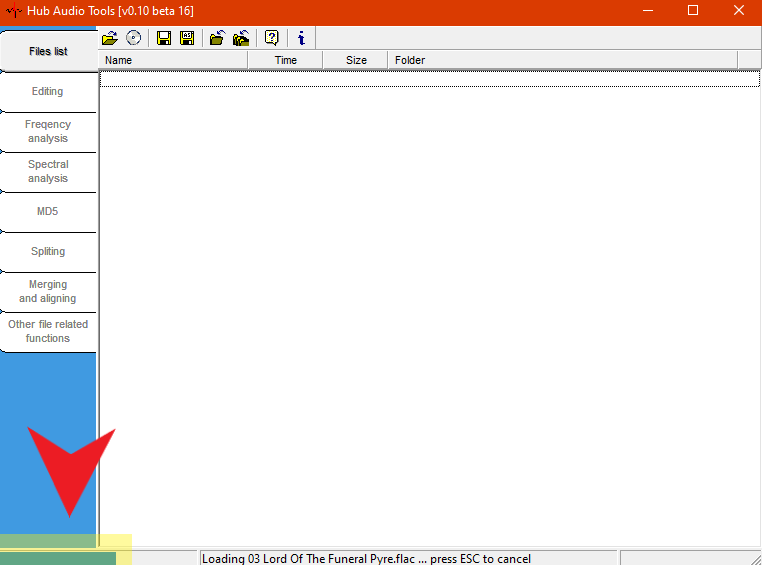
After you find the file click the “Open” button. Give the program a few moments to load the file. You will see a progress meter at the bottom left.

How To Create A Frequency Analysis Using HAT Screen 6

STEP 6:

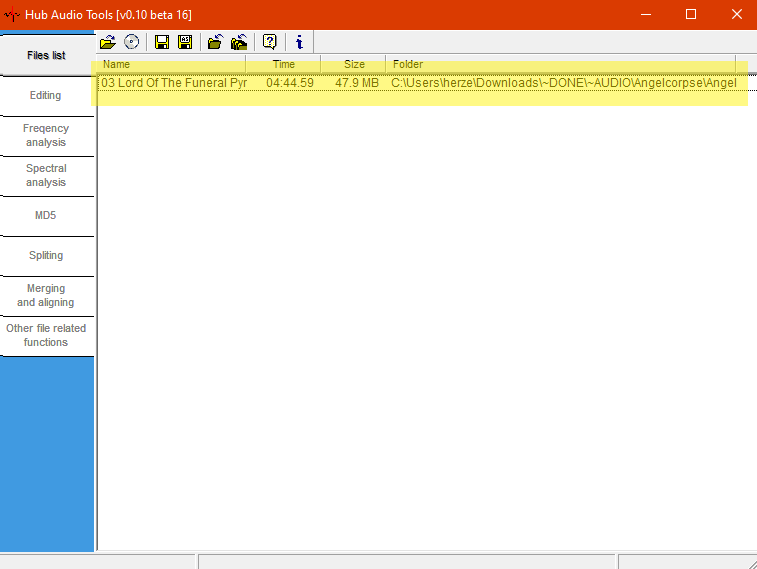
You should see the file you picked at the top of the program window.

How To Create A Frequency Analysis Using HAT Screen 7

STEP 7:
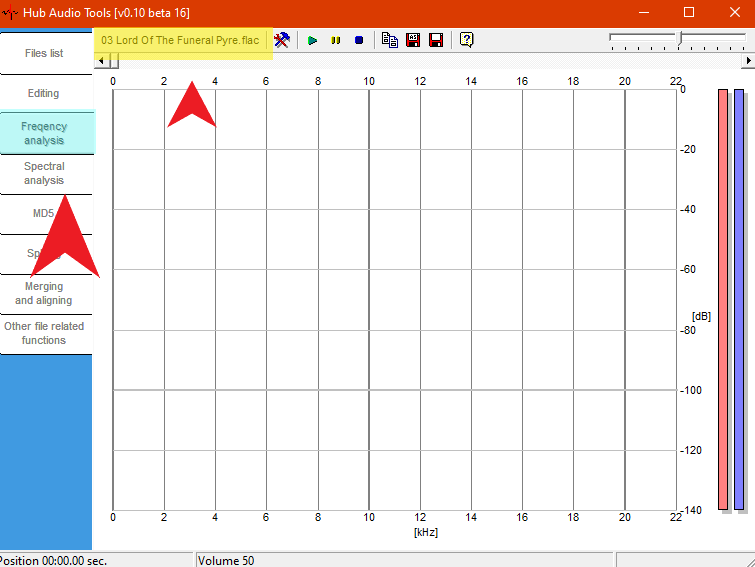
Now you can begin your frequency analysis. Click the “Frequency analysis” button to your left.

How To Create A Frequency Analysis Using HAT Screen 8

BLUE: Frequency analysis button engaged.

YELLOW: The name of your file you wish to analyze.

STEP 8:

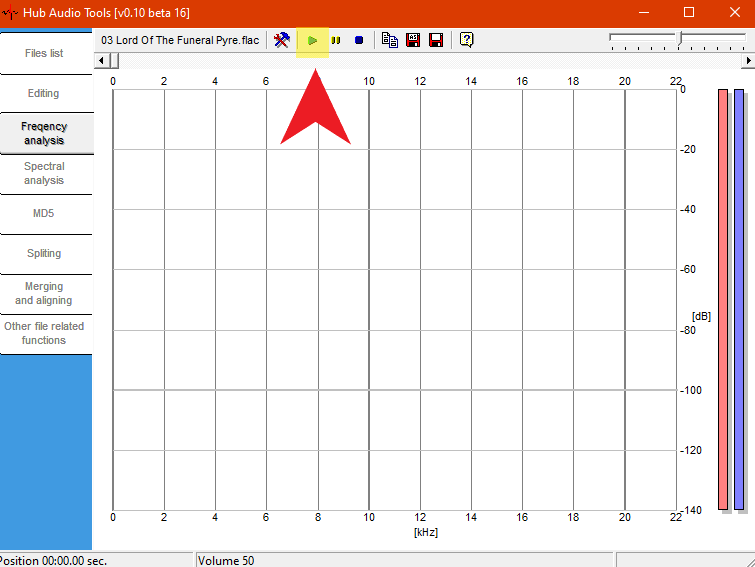
Click the green arrow next to the window that shows your file name to start the analysis.

How To Create A Frequency Analysis Using HAT Screen 9
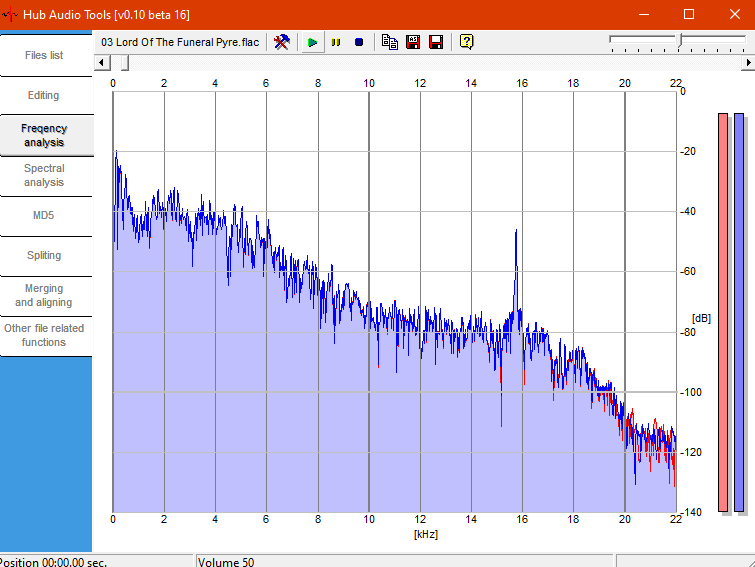
Once you click that button an animated graph will start. You can usually tell when watching the graph if it will be mp3 sourced or not, but a good practice to apply is getting a screen shot of the frequency analysis. This is important because some other traders may require it or it maybe mandatory to upload the show to a site like DIME or TTD. This is the outcome of the screen shot made of the graph.

How To Create A Frequency Analysis Using HAT Screen 10

How Do I Make That Screen Shot?

You can make the screen shot easily in the HAT software if you ran it as an administrator as stated at the beginning of this tutorial.
After you click the green arrow and the song is playing you can grab your screen shot. The program will do this for you just by following these simple steps below.
STEP 9:
To automatically place a screen shot in the same folder as the show click the little disk icon at the top right. This will place an image file in your show directory called “Frequency Analysis.jpg“.

How To Create A Frequency Analysis Using HAT Screen 11

Now check your show to see that the file is there. That’s it! Nothing else to do to grab a screen shot!
Any comments or questions? Post them below!
Len Kaiser
HerzeleidMeister is a metal bootleg trader from Little Rock, Arkansas who has traded off and on for over 20 years. He enjoys sharing his knowledge & insights with other traders to help them with any trading hurdles they may have.

Leave a Reply

Your email address will not be published. Required fields are marked *